Presenting uncertainty with confidence
A systematic and transparent management of uncertaintyuncertainty
Lack of precision or unpredictability of the exact value at a given moment in time. It does not usually imply lack of knowledge. Often, the future state of a process may not be predictable, such as a roll with dice, but the probability of finding it in a certain state may be well known (the probability of rolling a six is 1/6, and flipping tails with a coin is 1/2). In climate science, the dice may be loaded, and we may refer to uncertainties even with perfect knowledge of the odds. Uncertainties can be modelled statistically in terms of pdfs, extreme value theory and stochastic time series models. increases trust between the providers of climate impactclimate impact
See Impact Assessment indicators and users. Better understanding of uncertainty of climate impact indicators and how the level of uncertainty influences the confidenceconfidence
The validity of a finding based on the type, amount, quality, and consistency of evidence (e.g., mechanistic understanding, theory, data, models, expert judgment) and on the degree of agreement. Confidence is expressed qualitatively (Mastrandrea et al., 2010).
of a climate impact indicator is a prerequisite for better decision making.
A unique aspect of the CLIPC portal is the systematic presentation of expert-based confidence information for climate impact indicators for which a quantitative analysis is not always possible. With that the CLIPC project paid special attention on communicating information about the confidence users can have in the various data sets and indicators in a qualitative and transparent way. See: “Expert-based confidence information” (An expert is a scientist who calculated and provided the climate impact indicator for the portal.)
In addition to the expert-based climate information, the users can explore the robustness of a set of climate impact indicators derived from an ensembleensemble
A collection of model simulations characterising a climate prediction or projection. Differences in initial conditions and model formulation result in different evolutions of the modelled system and may give information on uncertainty associated with model error and error in initial conditions in the case of climate forecasts and on uncertainty associated with model error and with internally generated climate variability in the case of climate projections. of climate changeclimate change
Climate change refers to a change in the state of the climate that can be identified (e.g., by using statistical tests) by changes in the mean and/or the variability of its properties, and that persists for an extended period, typically decades or longer. Climate change may be due to natural internal processes or external forcings such as modulations of the solar cycles, volcanic eruptions and persistent anthropogenic changes in the composition of the atmosphere or in land use. Note that the United Nations Framework Convention on Climate Change (UNFCCC), in its Article 1, defines climate change as: 'a change of climate which is attributed directly or indirectly to human activity that alters the composition of the global atmosphere and which is in addition to natural climate variability observed over comparable time periods'. The UNFCCC thus makes a distinction between climate change attributable to human activities altering the atmospheric composition, and climate variability attributa projections. See “Climate Signal Maps”
“Expert-based confidence information”
The indicator toolkit allows the user to view and explore climate impact indicators. When you select a dataset for a climate impact indicators, a button called ‘confidence’ is highlighted under the "active" tab. The colour of the ‚confidence‘ button summarises the degree of confidencedegree of confidence
The degree of confidence defines the degree to which we trust an outcome - no matter if this outcome is a climate impact indicator derived from surface observations, re-analysis, simulations or projections describing the bio-physical or socio-economic impact of climate impact. The degree of confidence results from ‘evidence and agreement’ of the datasets used for a selected climate impact indicator and what ‘type of method’ is used for the calculation of it. ranging from red (=‘low’) to green (=‘high’). By clicking on it detailed information about the degree of confidence and the sources of uncertainties are presented in the confidence fact sheet.
‘Confidence’ button represents degree of confidence: red=low, orange=medium, green=high, white=not available
The confidence fact sheet is divided in two parts. The upper part is related to the expert-based description of what contributes to the degree of confidence. It is based on expert knowledge considering evidence and agreement and the type of method that was used for the calculation of this indicator. The degree of confidence is summarised in a colour bar.
In the lower part of the confidence fact sheet, you find a summary of the main sources of uncertainty related to the selected dataset. These sources of uncertainty belong either to a source that is reducible (incomplete knowledge) or that is non-reducible (unpredictability and stochasticity).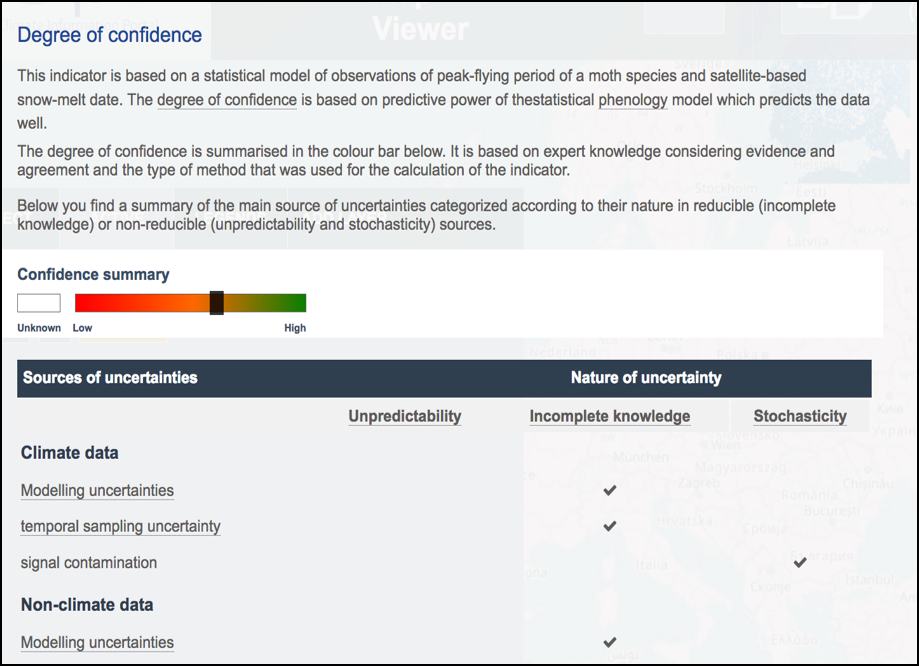
Upper half: Expert-based description of confidence including a summary of the degree of confidence
Lower half: Expert-collated list of sources of uncertainty differentiated according to their reducible or non-reducible nature
“Climate signal maps”
Under the ‘compare function’ you can select a spatial visualisation of the robustness for a set of climate impact indicators. These 'climate signal maps' help you to identify regions where robust climate changes are derived from an ensemble of multi-model climate simulations. "Robust" is thereby defined as the agreement of simulations toward the projected changes as well as with the portion of the simulations that project statistically significant changes.
Climate signal maps are available for the ‘worst case scenario’ RCP8.5 and the following climate impact indicators: wet days, heavy precipitation days, tropical nights, ice days, frost days, heating days, summer days. Select the dataset named ‘climatesignalmap’ and tick the box ‘Climate Signal Map’ below the map viewer.
For more information about the method: see D8.4 under http://www.clipc.eu/project-information/deliverables-and-milestones and Pfeifer et al. (2015): Robustness of ensemble climate projections analyzed with climate signal maps: seasonal and extreme precipitation for Germany. Atmosphere, 6(5), 677-698; doi:10.3390/atmos6050677
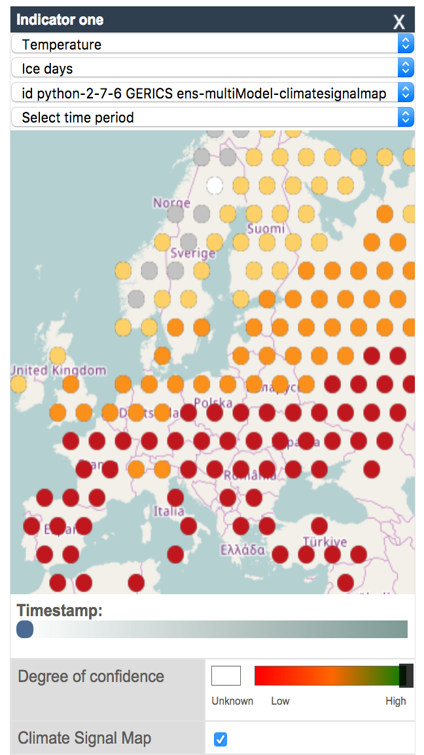 |
Example of decrease in ice days for spatial resolutionresolution In climate models, this term refers to the physical distance (meters or degrees) between each point on the grid used to compute the equations. Temporal resolution refers to the time step or the time elapsed between each model computation of the equations. of about 50 km x 50 km grid cell. Each circle represents the climate change signal average over 4x4 grid cells. The colour of the circles indicate: yellow- small robust decrease (less then 5 days) orange- medium robust decrease (between 5 and 30 days) red - large robust decrease (more then 30 days) Grey circles present regions where the climate change information is not robust. Regions white circles show an increase or no change in ice days. |