D7.1 A review of climate impact indicators
Objectives: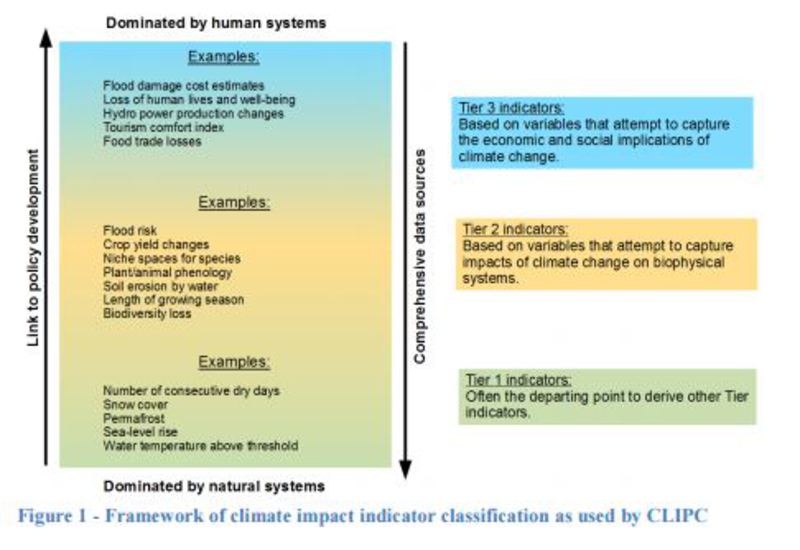
This deliverable has five main objectives:
1 - Elaboration of criteria for examining climate impactclimate impact
See Impact Assessment indicators.
2 - Documentation of an expert workshop involving relevant partners to discuss the criteria.
3 - Creation of a catalog of potential impact indicators to be made available via CLIPC.
4 - Assessment of strengths and weaknesses of climate impact indicators.
5 - Identify mismatches between user needs and the indicators documented.
Results:
In this deliverable, a total of 81 climate changeclimate change
Climate change refers to a change in the state of the climate that can be identified (e.g., by using statistical tests) by changes in the mean and/or the variability of its properties, and that persists for an extended period, typically decades or longer. Climate change may be due to natural internal processes or external forcings such as modulations of the solar cycles, volcanic eruptions and persistent anthropogenic changes in the composition of the atmosphere or in land use. Note that the United Nations Framework Convention on Climate Change (UNFCCC), in its Article 1, defines climate change as: 'a change of climate which is attributed directly or indirectly to human activity that alters the composition of the global atmosphere and which is in addition to natural climate variability observed over comparable time periods'. The UNFCCC thus makes a distinction between climate change attributable to human activities altering the atmospheric composition, and climate variability attributa and impact indicators are examined using a consistent set of reference criteria. These include aspects such as the methodological description of indicators, the data requirements and availability for indicator calculation, treatment of uncertaintyuncertainty
Lack of precision or unpredictability of the exact value at a given moment in time. It does not usually imply lack of knowledge. Often, the future state of a process may not be predictable, such as a roll with dice, but the probability of finding it in a certain state may be well known (the probability of rolling a six is 1/6, and flipping tails with a coin is 1/2). In climate science, the dice may be loaded, and we may refer to uncertainties even with perfect knowledge of the odds. Uncertainties can be modelled statistically in terms of pdfs, extreme value theory and stochastic time series models., fitness for purpose of indicator time series and seven other relevant criteria. An analysis of previous work conducted by initiatives providing collections of climate indicators, and follow-up discussions in an expert meeting workshop, ensures that the criteria selected are in line with the core purposes of WP7.
The indicators were grouped in three tiers, with Tier-1 focusing on the climate systemclimate system
The climate system is the highly complex system consisting of five major components: the atmosphere, the hydrosphere, the cryosphere, the lithosphere and the biosphere, and the interactions between them. The climate system evolves in time under the influence of its own internal dynamics and because of external forcings such as volcanic eruptions, solar variations and anthropogenic forcings such as the changing composition of the atmosphere and land use change., Tier-2 indicators the impacts of climate change in bio-physical systems and Tier-3 indicators on the socio-economic systems affected by climate change. An analysis of the scientific and technical strengths and weaknesses of indicators was feasible but only at an aggregate level. As a particular strength of indicators gathered it can be pointed out that a large proportion of the input data for the indicators is in the public domain. This is mostly visible for Tier-1 and Tier-2 indicators. For half of the Tier-3 indicators documented some data restrictions have been documented. It should also be noted that the total number of Tier-3 indicators is relatively small in comparison with the other Tiers.
Indicator uncertainty is a key issue. In the indicator documentation, some information on uncertainties was available for approximately 2/3 of the indicators. The detail of description varies but in general information of uncertainty introduced by the indicator method and that related to the input data is documented. This particular aspect is to be further strengthened in the running of WP7 via more engagement on harmonizing the uncertainty descriptions. An apparent weakness of the indicators documented is the lack of regular updating. This is particularly the case when the indicators have been developed and presented as the output of specific research projects and not maintained by organizations responsible for monitoring or statistical data.
An evaluation of strengths and weaknesses on indicators-by-indicator basis has been proposed and conducted for particular cases. Its completion will need to expand beyond the time frame of this deliverable as an overarching activity of WP7 until the production of the CLIPC portal.
In an attempt to explore strengths and weaknesses of indicators further, we used preliminary results of the user consultation of WP2 in an attempt to evaluate indicators for specific purposes (as stated by users). Although the preliminary user consultation made it possible to identify general uses of indicators (e.g., production of riskrisk
often taken to be the product of the probability of an event and the severity of its consequences. In statistical terms, this can be expressed as Risk(Y)=Pr(X) C(Y|X), where Pr is the probability, C is the cost, X is a variable describing the magnitude of the event, and Y is a sector or region.
and vulnerabilityvulnerability
The propensity or predisposition to be adversely affected. Vulnerability encompasses a variety of concepts including sensitivity or susceptibility to harm and lack of capacity to cope and adapt. assessments), details on particular applications of indicator by users are missing. Because only general uses are known, the evaluation of indicators from a user’s perspective suffers from our incomplete knowledgeincomplete knowledge
Incomplete knowledge arises from the imperfection of our knowledge. It concerns what ‘we do not know’ at this moment but might know in the future, if sufficient time and resources are available to perform additional research or collect more data. 'Incomplete knowledge' is therefore reducible. on how much weight a particular user might attribute to particular strengths and weaknesses. Despite these limitations, the deliverable gathered an extensive set of information on impact and climate change indicators and developed the approach for analyzing strengths and weaknesses of indicators. The documentation sets the standards of information in the metadatametadata
Information about meteorological and climatological data concerning how and when they were measured, their quality, known problems and other characteristics. to be included for the impact indicators in the CLIPC portal.
The sample of indicators gathered at the time of writing have been observed to match the user needs for using indicators as input for climate research and for the purposes of awareness raising. The uses of supporting the elaboration of adaptationadaptation
The process of adjustment to actual or expected climate and its effects. In human systems, adaptation seeks to moderate harm or exploit beneficial opportunities. In natural systems, human intervention may facilitate adjustment to expected climate and its effects. strategies and vulnerability studies can already be supported by the indicators gathered, although in these cases it is still preliminary to make definitive judgments in the light of draw backs previously highlighted. Further interaction with users and subsequent updates of indicator documentation will help to clarify this.
Finally, in order to pave the way for data integration within WP7, two tentative developments of new impact indicators are envisioned, namely, an indicator of heat-stress of population and moth phenologyphenology
The relationship between biological phenomena that recur periodically (e.g., development stages, migration) and climate and seasonal changes. index. A brief description of the types of data used for the calculation and the schematic steps for indicator calculation are presented.
Perspectives:
The deliverable has set the foundation for much of the work ahead in WP7 but also in WP8. An overall scheme for indicator documentation was put in place and a first large bulk of indicator documented. The next steps are the harmonization of some criteria in order to allow for a full use of the database in discerning indicator strengths and weakness on a more detailed level. This is a long term activity within WP7.
As long term perspectives, the work of WP7 will be focused on the completion and expansion of the review of indicators made in this deliverable. The completion will benefit from a longer time frame for filling missing relevant criteria information via more interactions with the partners. In addition, more detailed insights from ongoing user consultation will hopefully allow for a better matching of the indicator list collected to the user needs. The expansion of the indicator list will particularly focus on expanding the Tier2 and 3 indicators.