Use case advice on data regarding extreme rainfall projections to an insurance company
Starting point
A climateclimate
Climate in a narrow sense is usually defined as the average weather, or more rigorously, as the statistical description in terms of the mean and variability of relevant quantities over a period of time ranging from months to thousands or millions of years. The classical period for averaging these variables is 30 years, as defined by the World Meteorological Organization. The relevant quantities are most often surface variables such as temperature, precipitation and wind. Climate in a wider sense is the state, including a statistical description, of the climate system
scientist is asked for advice on data regarding extreme rain fall projections by an insurance company for the purpose of differentiating floodflood
The overflowing of the normal confines of a stream or other body of water, or the accumulation of water over areas that are not normally submerged. Floods include river (fluvial) floods, flash floods, urban floods, pluvial floods, sewer floods, coastal floods, and glacial lake outburst floods.
damage insurance rates between different regions in France. The climate researcher is faced with a paradox. On the one hand, she does not want to spend much time on this task, on the other side she fears that wrong decisions might be taken in case appropriate information on uncertaintyuncertainty
Lack of precision or unpredictability of the exact value at a given moment in time. It does not usually imply lack of knowledge. Often, the future state of a process may not be predictable, such as a roll with dice, but the probability of finding it in a certain state may be well known (the probability of rolling a six is 1/6, and flipping tails with a coin is 1/2). In climate science, the dice may be loaded, and we may refer to uncertainties even with perfect knowledge of the odds. Uncertainties can be modelled statistically in terms of pdfs, extreme value theory and stochastic time series models. is not delivered to the insurance company. In order to provide guidance, the climate researcher envisions providing the insurance company basically two products:
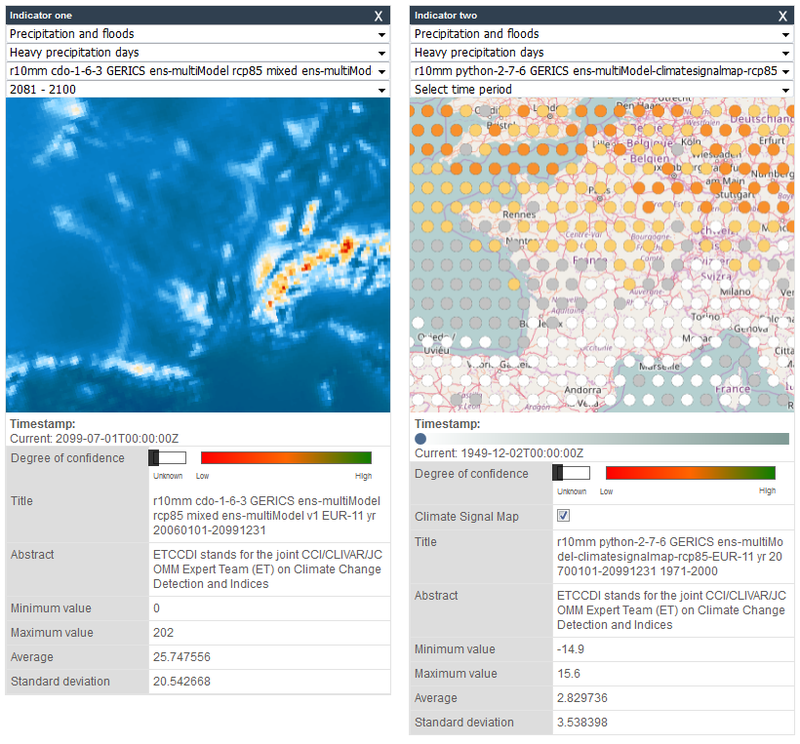
- A plot showing the multi-model uncertainty ranges of heavy precipitation.
- Climate signal map showing the regions in which the change is robust.
The first information would highlight the possible ranges of heavy precipitation in the future while the second product would highlight the robustness, or lack of, of the projections.
Basic approach
The analysis comprises one task:
- Load indicator for heavy precipitation days
Basic indicators
- Heavy precipitation days (rcp85)
- Heavy precipitation days (climate signal map)
CLIP-C tools featured
Time series tool, Compare tool
Contact person
Analytical steps in detail
- Select the precipitation and floods theme on the left side of the compare tool.
- Load indicator ‘heavy precipitation days’.
- Select the following dataset: r10mm cdo-1-6-3 GERICS ens-multiModel rcp85 mixed ens-multiModel v1 EUR-11 yr 20060101-20991231
- Select the 2081-2100 time period
- Load indicator ‘heavy precipitation days’ in the right side of the combine tool
- Select the following dataset: r10mm python-2-7-6 GERICS ens-multiModel-climatesignalmap-rcp85-EUR-11 yr 20700101-20991231 1971-2000
- Frame the map window by zooming and panning so that France becomes visible.
- Tick the “climate signal map” box under the second map.