Use case raising awareness on agricultural production for Southern France
Starting point
An environmental agency is commissioned to hold a workshop about climate changeclimate change
Climate change refers to a change in the state of the climate that can be identified (e.g., by using statistical tests) by changes in the mean and/or the variability of its properties, and that persists for an extended period, typically decades or longer. Climate change may be due to natural internal processes or external forcings such as modulations of the solar cycles, volcanic eruptions and persistent anthropogenic changes in the composition of the atmosphere or in land use. Note that the United Nations Framework Convention on Climate Change (UNFCCC), in its Article 1, defines climate change as: 'a change of climate which is attributed directly or indirectly to human activity that alters the composition of the global atmosphere and which is in addition to natural climate variability observed over comparable time periods'. The UNFCCC thus makes a distinction between climate change attributable to human activities altering the atmospheric composition, and climate variability attributa and its associated impacts on agricultural production for Southern France. For the purposes of awareness raising the organization decides that the best way to raise awareness is to narrow the complex issue of “agricultural production” – something farmers are interested in - to the use of simpler metrics (see Figure 2), namely, future change in the value of yearly precipitation. Additionally, the agency would like to present the results aggregated to administrative levels of France, assuming that farmers would better identify the geographic extension of their activities. Accordingly, the consultant decides to provide the following information:
- Future change in the value of yearly precipitation aggregated by administrative region.
Basic approach
The analysis comprises three tasks:
- Load indicator ‘total wet precipitation’ for a historical period.
- Load indicator ‘total wet precipitation’ for a future period.
- Determine the change in yearly precipitation.
Basic indicators
- Total wet-day precipitation (historical)
- Total wet-day precipitation (rcp45)
CLIP-C tools featured
Combine tool, spatial aggregation
Contact person
Analytical steps in detail
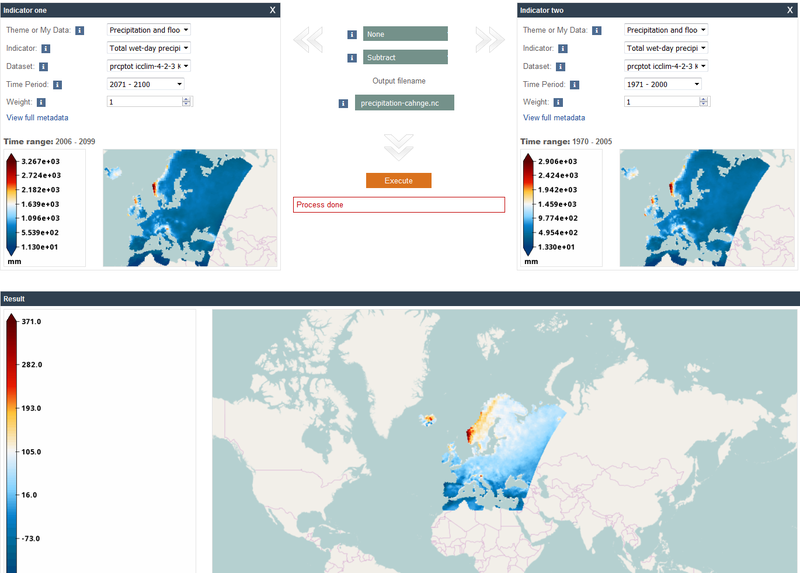
- Select the precipitation and floods theme on the right side of the combine tool.
- Load indicator ‘total wet precipitation’.
- Select the following dataset: prcptot icclim-4-2-3 KNMI ens-multiModel historical r1i1p1 SMHI-RCA4 v1
EUR-44 SMHI-DBS43 EOBS10 bcref-1981-2010 yr 19700101-20051231 - Select the 1971-2000 time period
- Load indicator ‘total wet precipitation’ in the left side of the combine tool
- Select the following dataset: prcptot icclim-4-2-3 KNMI ens-multiModel rcp85 r1i1p1 SMHI-RCA4 v1 EUR-44
SMHI-DBS43 EOBS10 bcref-1981-2010 yr 20060101-20991231 - Select the 2071-2100 time period
- Select “none” in the normalization box
- Select subtract in the process box
- Name the output as “precipitation-change.nc”
- Hit execute
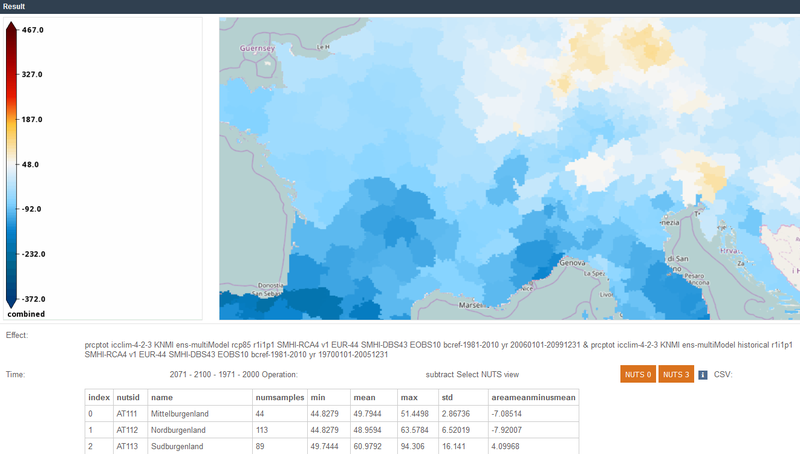
- In the bottom of the combine tool you will find the option to aggregate the results to NUTS3 level. Press the button and wait a few seconds as the process can be computation intensive.
- Zoom in to Southern France to see the aggregated results both visually (map) and quantitatively (tabular form).