D7.4 Guidance on production and use of indicators
Objectives:
The objectives of this deliverable can be summarized as follows:
- To develop stylized guidance on the use and production of indicators.
- To tailor the guidance according the needs of CLIPC user groups climateclimate
Climate in a narrow sense is usually defined as the average weather, or more rigorously, as the statistical description in terms of the mean and variability of relevant quantities over a period of time ranging from months to thousands or millions of years. The classical period for averaging these variables is 30 years, as defined by the World Meteorological Organization. The relevant quantities are most often surface variables such as temperature, precipitation and wind. Climate in a wider sense is the state, including a statistical description, of the climate system. scientists, impacts researchers and intermediary organizations. - To enumerate the CLIPC functionalities and data required in order to operate the stylized guidance.
- To practically illustrate the guidance steps in the CLIPC portal.
- To formulate suggestions for future work concerning provision of guidance to end-users.
Results:
Building on the specific requirements of potential users, this deliverable elaborates structured guidance on 4 simulated tasks regarding the use and production of climate impactclimate impact
See Impact Assessment indicators in the CLIPC portal. These tasks use concrete “data usage purposes” suggested by potential end-users in D2.2 User requirements, Part 2. The tasks have been structured according to the potential user-groups of CLIPC, and can be summarized as follows:
- Give advice on data and climate impact indicators to others (Intermediary organizations, Climate Scientists and Impacts researchers)
- Create awareness (Intermediary organizations)
- Perform riskrisk
often taken to be the product of the probability of an event and the severity of its consequences. In statistical terms, this can be expressed as Risk(Y)=Pr(X) C(Y|X), where Pr is the probability, C is the cost, X is a variable describing the magnitude of the event, and Y is a sector or region. and vulnerabilityvulnerability
The propensity or predisposition to be adversely affected. Vulnerability encompasses a variety of concepts including sensitivity or susceptibility to harm and lack of capacity to cope and adapt. assessments (Impact researchers) - Input in research on climate changeclimate change
Climate change refers to a change in the state of the climate that can be identified (e.g., by using statistical tests) by changes in the mean and/or the variability of its properties, and that persists for an extended period, typically decades or longer. Climate change may be due to natural internal processes or external forcings such as modulations of the solar cycles, volcanic eruptions and persistent anthropogenic changes in the composition of the atmosphere or in land use. Note that the United Nations Framework Convention on Climate Change (UNFCCC), in its Article 1, defines climate change as: 'a change of climate which is attributed directly or indirectly to human activity that alters the composition of the global atmosphere and which is in addition to natural climate variability observed over comparable time periods'. The UNFCCC thus makes a distinction between climate change attributable to human activities altering the atmospheric composition, and climate variability attributa (Impact researchers)
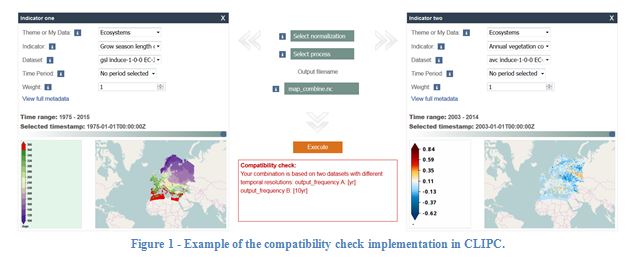
In addition, a section elaborates how to derive relevant information from the file name of CLIPC datasets, guidance requested by the users during the consultations.
Perspectives:
With the need for guidance taking a very prominent role during the elaboration of the CLIPC portal and the user consultations, it is expected that a similar requirement from the side of end-users will emerge in forthcoming work promoting the use of climate information portals to wider audiences. Accordingly, the examples of guidance on the use and elaboration of impact indicators by user group can facilitate future similar work.
Download this deliverable here